Sources for Our Data
Below are the sources that were used to create the graph above.
- Freddie Mac: This organization tracks and publishes historical mortgage rates in the US, including 30-year fixed rates. You can find an interactive chart here: https://www.freddiemac.com/pmms. You can adjust the timeframe to select the past 30 years and also download the data for further analysis.
- Federal Reserve Economic Data (FRED): This site provides access to a wide range of economic data, including mortgage rates. You can find historical 30-year fixed-rate mortgage averages here: https://fred.stlouisfed.org/tags/series?t=30-year%3Bmortgage. Select the desired timeframe and export the data as a CSV file to create your own chart.
- Bankrate: This financial website offers a section dedicated to historical mortgage rates, with charts and data dating back to the 1970s: https://www.bankrate.com/mortgages/todays-rates/. You can explore their historical mortgage rate chart and filter for the past 30 years.
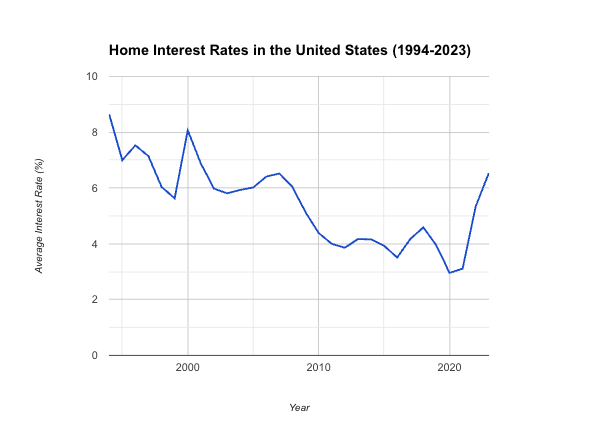
A 30-Year Journey of US Home Interest Rates
In the tapestry of American economics, few threads are as colorful or as consequential as home interest rates. They are not just numbers; they are a reflection of our economy’s heartbeat, influencing decisions from kitchen tables to the corridors of power. This post embarks on a voyage through the past three decades, tracing the ebb and flow of US home interest rates and uncovering the stories they tell about our times.
The Early 90s: A Time of Adjustment
Our journey begins in the early 1990s, a period of economic recalibration following the exuberance of the 1980s. Interest rates were high, peaking at 8.64% in 1994, a sobering challenge for homebuyers. But even as these rates commanded a hefty price for borrowing, they set the stage for the economic narratives that would follow.
The Dot-Com Boom and Its Aftermath: Late 90s to Early 2000s
As the millennium approached, the digital revolution was in full swing. The dot-com boom ushered in an era of optimism, and interest rates reflected this zeitgeist, gradually declining to more palatable levels. By 1998, rates had dipped to 6.04%, making homeownership more accessible and fueling a housing market surge.
Yet, as with all booms, a correction was on the horizon. The early 2000s brought the dot-com bust and economic uncertainty, but surprisingly, home interest rates continued their descent, reaching a then-historic low of 5.81% in 2003. This period underscored the complex dance between economic forces and interest rates, a dance choreographed by market dynamics and Federal Reserve policies.
The Mid-2000s: Stability, Speculation, and the Seeds of Crisis
The mid-2000s were characterized by relative stability. Rates hovered around the 6% mark, a golden mean that neither stifled borrowing nor overheated the market. Yet beneath this calm surface, speculative forces were at work, inflating a housing bubble that would have far-reaching consequences.
The Financial Crisis and Its Aftermath: Late 2000s to Early 2010s
The climax of our tale arrives with the 2008 financial crisis. In its wake, interest rates plummeted as the Federal Reserve took unprecedented steps to stabilize the economy. By 2012, rates had fallen to a record low of 3.86%, a figure once unimaginable. This era was marked by recovery and opportunity, as lower rates opened doors for many to buy or refinance homes, even as the economy sought to regain its footing.
The Recent Decade: Uncharted Waters
Our most recent chapter is perhaps the most unpredictable. The 2020s began with rates at near-historic lows, a response to global economic uncertainties. The pandemic further pushed rates down, with 2020 seeing an astonishing 2.96%. Yet, as we emerge from these unprecedented times, rates are on the rise again, standing at 6.53% in 2023, a clear signal of changing economic tides.
Looking Ahead: Navigating Future Currents
What does the future hold for home interest rates? If history teaches us anything, it’s that they are a barometer of broader economic health and sentiment. As we face new challenges and opportunities, from technological advancements to climate change, rates will continue to reflect our collective journey.
Conclusion: The Story Continues
The past 30 years have been a remarkable journey for US home interest rates, from the highs of the early 90s to the record lows of the 2020s. Each rate tells a story of economic cycles, policy decisions, and the American dream of homeownership. As we look to the horizon, one thing is clear: the journey is far from over. The rates will continue to write new chapters in our economic narrative, influencing decisions and dreams for years to come.
Sources for Our Data
In crafting this exploration of the 30-year journey of US home interest rates, we’ve relied on data from several esteemed organizations renowned for their comprehensive financial insights. These sources have been instrumental in providing the historical context and trends discussed throughout this post:
-
Freddie Mac: A cornerstone in understanding the fluctuations in home interest rates, Freddie Mac’s Primary Mortgage Market Survey® offers a weekly insight into the trends that have shaped the housing market over the decades. Their extensive archives provide a detailed look at the shifts in 30-year fixed rates, among others. For more in-depth analysis, visit Freddie Mac’s Historical Data.
-
Federal Reserve Economic Data (FRED): Operated by the Federal Reserve Bank of St. Louis, FRED offers a treasure trove of economic data, including mortgage rates. Their platform allows for an intricate examination of the historical averages of 30-year fixed-rate mortgages, presenting a macroeconomic view of the housing market’s evolution. Explore their resources at FRED – Mortgage Rates.
-
Bankrate: Known for its financial expertise, Bankrate provides historical mortgage rate data that traces back to the 1970s. Their detailed charts and analysis offer a broader perspective on how mortgage rates have impacted homeownership over time. Dive into the past rates at Bankrate – Historical Mortgage Rates.
-
The Mortgage Reports: With a focus on mortgage analysis, The Mortgage Reports offers insights and interactive charts that cover various aspects of mortgage rates, including historical trends. Their resources are invaluable for those looking to understand the nuances of rate changes and their implications. For interactive exploration, visit The Mortgage Reports – Historical Mortgage Rates.